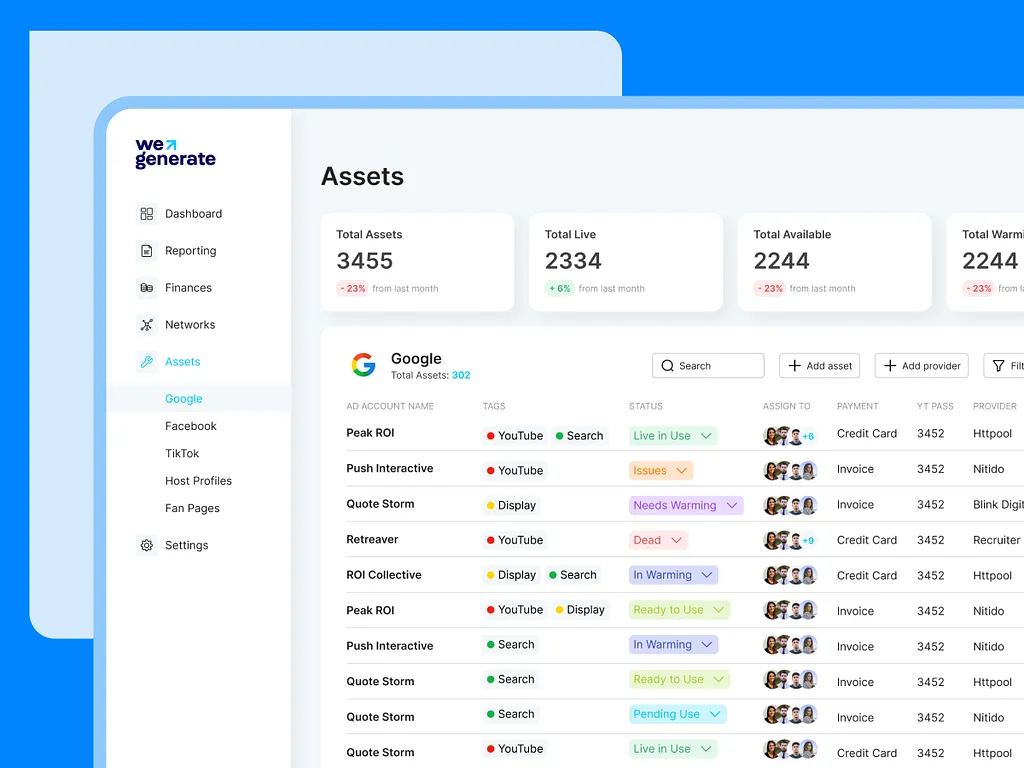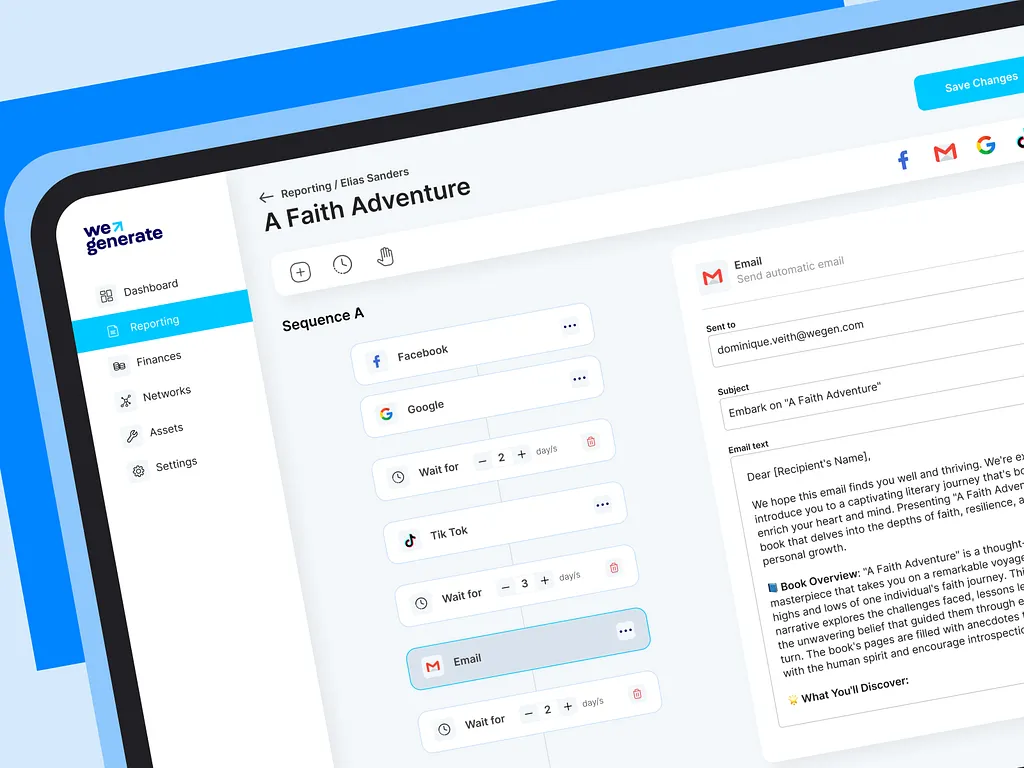

Live KPI dashboards: every channel, one number
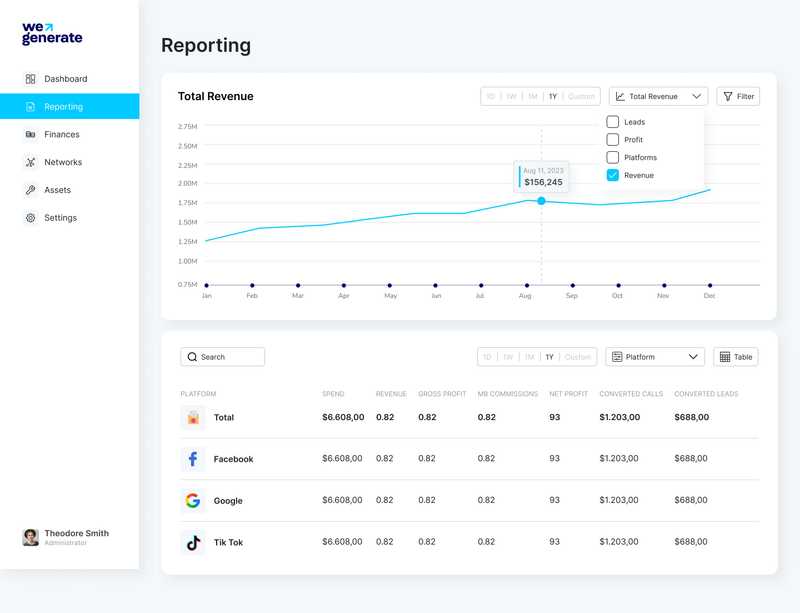
The dashboard is the join the business did not have. Every ad source is pulled on a schedule, every call Ringba reports is matched to the campaign that produced it, and out the other side come the figures that run the operation: spend, revenue, profit, RPC and billable calls, each against last month. Under them, the same series over any window from a day to a year, with spend, profit and billable leads switchable onto the same axis.
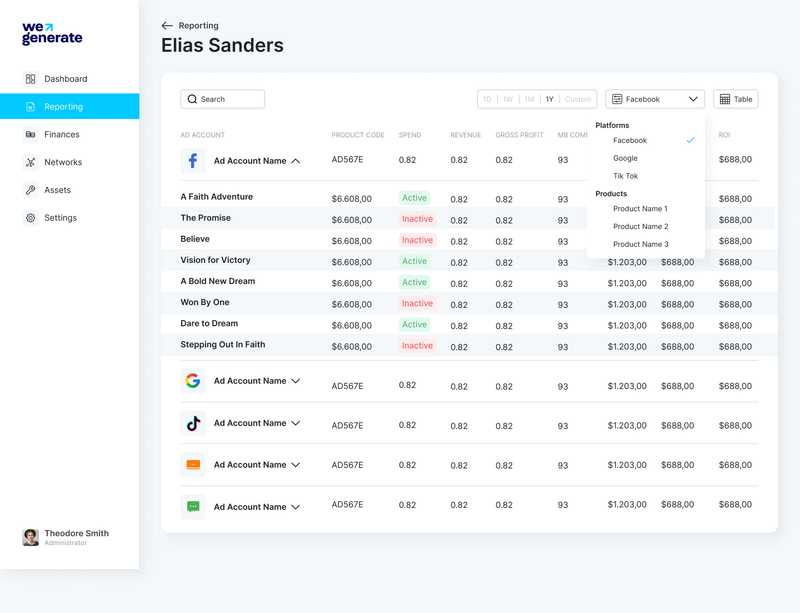
That switching is the point. A buyer watching spend climb while billable calls stay flat is watching a channel go bad, on one chart rather than inferring it from two. It cuts by product, so Medicare, ACA and final expense compare honestly despite different economics, and by platform, so all six sit on identical definitions rather than each network's own flattering ones. Leadership reads the same screen through performance boards and best-campaign views.
- Live KPI Dashboards
- Spend & Revenue Reconciliation
- RPC & Billable Calls
- Profit Ledger